Blog Post

Most chemical companies think they have a high sales and operation planning (S&OP) maturity, but do they really? Join us in testing the market!
We thank our partners at ORTEC and especially Chemometrics specialist Bas Groothuis for co-developing this content.
Cross-functional alignment is a complex challenge for chemical companies. Does this sound familiar to you? Perhaps your company has very diverse product portfolios and different production processes. For instance, you might be making both pharmaceutical components and plastic fibers and have very different processes in these business units. But how do you decide what to make and where to invest companywide? And how do you, within a business unit, decide what to produce over different timeframes to reach strategic goals while having a good margin?
We all know S&OP can help. S&OP helps you effectively achieve your company strategy. The higher your S&OP maturity, the better you can match supply and demand while steering towards strategic goals. AIMMS and ORTEC have developed a methodology to assess the maturity of the S&OP process. If you’re curious about where your chemical company stands, take the assessment today. You’ll get immediate feedback and can opt-in to receive a report to see where you stand compared to the market.
How mature is S&OP at your chemical company? Take this assessment to find out! – Tweet this
What do we see in the industry?
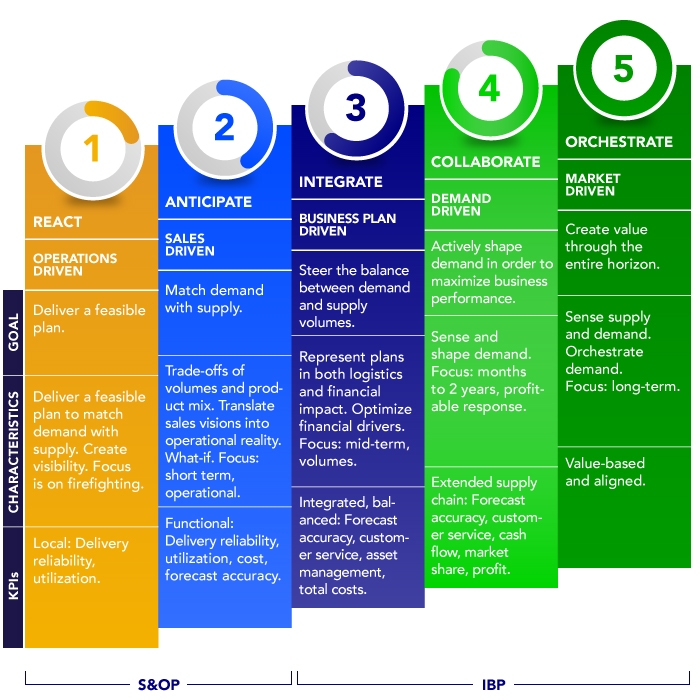
Based on the complexity and size of chemical companies, we’ve seen that most of them have achieved level 2 in S&OP maturity (out of 5 maturity levels). Most companies fail to reach level 3, due to alignment issues.
At a global company, a European plant might have an entirely different S&OP process than the one used in U.S. plants. As we have commonly seen in other companies, they might also be using different planning software, or a legacy solution like spreadsheets. This can result in different teams using different data formats, diverging results from data analysis, and hence poorly aligned decision making.
The consequences of misalignment across regions and departments
These are many issues that arise when teams don’t have a centralized S&OP workflow and common access to data. In this situation, teams in different regions typically have different ways to forecast demand. In such cases, it’s hard to align the team around a common source of truth. This makes it difficult to steer towards the desired strategic goals and to align operational activities like production planning.
Let’s take the example of a large fiber manufacturer. This company has a complex set of choices to make when it comes to deciding which products to manufacture. For instance, they didn’t have a clear view on the products with the highest margin, based on feedstock and operational expense. Due to poor internal alignment, some of their plants were also working overtime while others were significantly under-utilized. Plants that were pushed to the limit did not get enough time to carry out maintenance, so they suffered from high shutdown rates. Operating units used their own demand forecast; they had no centralized approach and saw frequent inventory violations. To make matters more complex, different departments also used their own method for estimating product costs. They had no centralized purchasing process. This resulted in high inventory volatility and unnecessarily high distribution costs. To overcome these challenges, a tailor-made S&OP process is necessary.
Following a holistic analysis performed by ORTEC experts, this large fabric manufacturer found that the production choices they were making resulted in plant downtime. It turned out that some types of fiber were more likely to cause shutdowns. With a tailor-made and global S&OP process, it would have been easier to address a strategic question: “do we want to keep producing these types of fiber or should we focus on others?” Their operations team would have had more insight into what happens throughout the value chain, so they would also know which customers are strategically important from a management stance. Getting departments to talk each other and contribute to the decision-making process is a key benefit of S&OP. Our approach brings marketing, sales, and operations teams together within complex organizations, resulting in successfully implemented S&OP processes and solutions. It’s crucial to note that the most important aspect of S&OP is the process and change management, not the tooling. Tooling is there to support organizations in decision making once the process improvements are clearly identified. Ultimately, your business goals should be leading in order to bring everyone around shared goals.
Other compelling business benefits of S&OP
Improved communication and alignment are not the only compelling advantages gained through a well-implemented S&OP process. We have seen customers improve on-time product delivery between 10-40% as a result of a well-executed S&OP process. In some cases, we have also seen inventory levels decrease up to 70%. Downtimes go down between 20-50% and plant efficiency has improved at some customers’ by up to 33%. Costs can also be brought down on the transport side, up to 30%. Overall, our customers see ROI within 6 to 24 months.
The benefits of well-executed S&OP: 20-50% less downtime, 33% more plant efficiency, 30% lower costs. Find out how you can improve S&OP at your chemical company – Tweet this
Assess your S&OP process
Do these challenges and benefits sound familiar? Have you successfully implemented S&OP at your chemical company? How mature is your process? Take our assessment to find out. We look forward to hearing your thoughts!