
Press Release
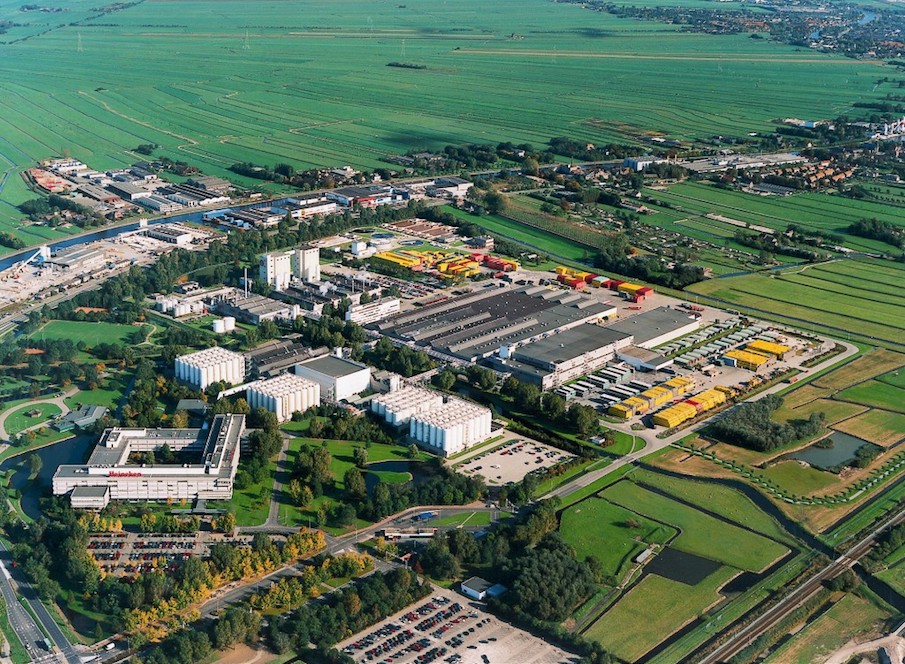
![]() Heineken is one of the world’s best-known beers. But for HEINEKEN International, the famed lager is only one of its products. The company owns more than 165 breweries around the world. It operates in 70 countries with a workforce of 80,000, producing over 300 specialty beers and ciders at international, regional, and local levels. Planning such a large operation efficiently is no doubt a challenge, but HEINEKEN’s quest for efficiency started in the company’s early years.
Heineken is one of the world’s best-known beers. But for HEINEKEN International, the famed lager is only one of its products. The company owns more than 165 breweries around the world. It operates in 70 countries with a workforce of 80,000, producing over 300 specialty beers and ciders at international, regional, and local levels. Planning such a large operation efficiently is no doubt a challenge, but HEINEKEN’s quest for efficiency started in the company’s early years.
In 1966, HEINEKEN became one of the first Dutch companies to adopt container shipping. Decades later, they would debut a climate-efficient shipping route between their brewery and the port of Rotterdam. Today, the company is betting on prescriptive analytics to plan its operations more efficiently and prevent lost sales in a constantly changing market. AIMMS has been a crucial partner in this journey. To learn more about these efforts, we spoke with Wilko Sierksma, Manager Network Design and Global S&OP at HEINEKEN.
1. Wilko, to start, could you tell us more about the supply chain division you work for?
I work for Global Supply Chain, a division based in Zoeterwoude (the Netherlands). Most people in my division work in capability development or centers of excellence designed to help operations centers improve their performance in logistics, customer service, or production. We are also tasked with building and maintaining the company’s centralized network design capability. This means we help the team answer questions about global production footprint design, such as:
- where should we build our breweries,
- where should we invest in capacity,
- how much capacity should we build in which location,
- what kind of equipment should we invest in and
- when should we invest.

A typical question we deal with could be: “should we invest in brewing capacity in South Africa or can we postpone that investment and save costs by importing beer from the Netherlands instead?” We are the team that helps decision-makers evaluate this trade-off.
The other part of my team’s responsibilities is what we call global S&OP. HEINEKEN is a very decentralized company. Every country or operating company has its own supply chain team and is responsible for managing its own capacity, demand, and supply. However, there are sometimes interests above the individual operating company. We help facilitate these overarching decision-making processes. For instance, you may have heard about HEINEKEN 0.0 (a non-alcoholic beer). We have certain locations in Europe that can produce this. Our team determines which countries should get the most volume of this product, where it should be produced, and which brewery each country should source it from.
2. Can you tell me about HEINEKEN’s AIMMS-based Brewing Capacity Model? I understand your team took ownership of this model. How did you do things before the introduction of AIMMS?
Yeah, so there was an existing Brewing Capacity Model which lived in a spreadsheet file. The model was developed by an intern 10 years ago and it really squeezed the juice out of Excel, making use of all the possible features. But it had its limitations, of course. To mention a few, version control was hard. People would mail the file back and forth and it would be difficult to know which version was the latest – not only from a content point of view but also from a functional point of view. This made it prone to error.
It was taxing to report above the country level with this tool. For instance, if I wanted to know what the HEINEKEN canning capacity was in Asia, I would have to sum up 20+ Excel files to sum up the data for all the breweries. There was no global master data in place either. So it was a huge effort to report on a global level.
Finally, this only allowed us to plan on a yearly level. We could take some seasonality into account, but It was very complex to explain to users how the algorithm that calculated stock builds based on the seasonality of sales worked. In other words, it was not easy to use. This drove us to adopt a better strategic decision-support tool.
3. What made it the right moment to change?
The main reason was that we were trying to manage our investments as optimally as possible. This was not easy to do with an error-prone tool. We also do a lot of production capacity studies in different countries, but it always took a long time to gather and validate data for each country.
There was a need to centralize data collection and minimize the time spent on structuring and gathering data. We could no longer afford to spend 6 months on data collection projects because the market is changing fast. HEINEKEN is also growing, so there are more and more colleagues in different countries looking to answer questions about capacity planning and investments. We needed to change our capability to live up to their expectations.
4. I’m curious to learn more about your vision for the model. Can you tell us about that?
My vision was to have a tool that would allow me to answer any capacity question within a few clicks. Any question that a senior supply chain officer or senior stakeholder could ask. When we used spreadsheets, it would be impossible to assess the capacity of a certain brand in a certain region. Now, we can easily answer these questions within a few weeks.
5. How did the model come together?
First, we had to select a solution provider. We had several options on the table, but most were not very flexible. At the same time, we were looking for a cloud-based solution that supported optimization. Most importantly, it was important for us to be self-sufficient over time. We were not looking to rely on a consulting company whenever we needed to change something in our toolset.
We had existing AIMMS capabilities in-house, as we use other models built in AIMMS. The cloud-based deployment offered by AIMMS PRO coupled with the optimization capabilities AIMMS in known for, made it an obvious choice for us. With AIMMS, we can easily run several scenarios related to capacity investments.
In the AIMMS-based model, we can visualize demand on a country level and divide it into sales regions, based on historical sales. We have the capacity by brewery and use AIMMS to optimally allocate demand to each brewery given the expected demand and available capacity. It makes a complex exercise, that used to be painstaking and manual, much easier to perform. If we change any of our input parameters, we can simply run the model again and get an optimal allocation in a few clicks. So it gives us the insights we were looking for.
6. What role did change management play to roll this out successfully?
“Change management played a huge role.”
We were aware of the importance of change management, but still underestimated it. One reason was that some operations centers don’t really need this tool. For instance, Mexico uses its own strategic planning tool. But we still need them to input their data to get global insights. The other thing that made adoption difficult was making sure to input the right data to make everything cloud-based. Once you have the master data in, it’s just a matter of maintaining and changing but putting the data in initially was time-consuming for users.
We organized webinars, created movies, implemented a communication plan early on, and set up a help desk. But in hindsight, we should have done more. About 70% of all countries implemented the tool and started using it quickly, but others (the big ones in particular) had to deal with the high season and struggled to prioritize it. I would say we needed to better understand the ‘sense of ownership’ and prioritization to make sure change management is successful in all operations centers.
7. How did AIMMS contribute to making change management easier?
AIMMS’ team is approachable. Communication lines are short, and we were able to influence the development of the software to our benefit. We had several discussions with AIMMS about the features we needed and we worked with Districon, an AIMMS implementation partner, to understand the capabilities of the software as well. AIMMS did a great job of making sure all our security requirements were in place as well. I like the AIMMS team’s agile way of working.
8. Who uses the model at HEINEKEN now?
Between 60 and 65 countries are using the tool and they will update the data in the model on a yearly basis. That will be the minimum usage per country. Some operating companies will use it for shift and material planning, and there’s potential for more. For now, my team is the big user. We have a Power BI solution on top of the model, allowing us to answer strategic questions very quickly.
All local management have access to the solution, but we need to evaluate how many are using it. A nice thing to mention is that we presented the AIMMS model and Power BI solution to our Chief Supply Chain Officer recently. He liked it and asked us to install the reporting on his iPad so he can get all the data and would like to see its use expand within local teams. The more enthusiastic users we have, the better.
9. How do you see the model evolving?
From a technology perspective, there are still some items to continue improving – especially on the data visualization front and table editing functions. These are functional improvements which are about to be implemented but they are not stopping us from using the tool.
From a learning perspective, we were happy to recently connect with Nike, another AIMMS customer, to learn about their adoption of this technology. Even though their operation is different, it’s good to see what kind of expectations we can have.
In terms of increasing adoption of the model, I expect that we will be able to drive more adoption as more countries start to share their experiences and use cases. This will be a continuous effort.
10. Do you see your use of AIMMS expanding to other areas?
Yeah, AIMMS is most valuable for its optimization capabilities, but you can use it for basic reporting as well. For instance, we currently have an Excel-based tool to calculate utility benchmarks. We use this tool to calculate what the energy consumption of a brewery should be. This is a simple application that could be easily built into AIMMS to facilitate collaboration and reporting.
11. What are you most proud of when it comes to your AIMMS project?
I’m proud of the fact that we were able to design, build, and implement a complex tool – with a limited budget – in a very short period. We had a clear MVP in view and improved it in incremental steps.
12. Besides gaining access to insights faster, what benefits do you expect to achieve with the tool?
With this tool, we can better assess when it makes sense to make capacity investments and when we can allocate production to other countries to postpone big investments. We can postpone CAPEX, sometimes millions of euros per year, simply by optimally allocating production capacity. We can also better understand when we need to ask for production support from other operating companies in order to prevent lost sales.

Contact Kees Ramselaar, Customer Development EMEA, to learn more about AIMMS.
Connect with Kees on LinkedIn.
What our readers are saying
Comments are closed.
This case study on modeling brewing capacity at Heineken is truly impressive! The strategic use of optimization models to drive cost savings is a testament to the power of analytics in the brewing industry. Kudos to Heineken for embracing innovative solutions to enhance efficiency and maximize resources. A great example of how data-driven insights can lead to tangible benefits. Well done!